
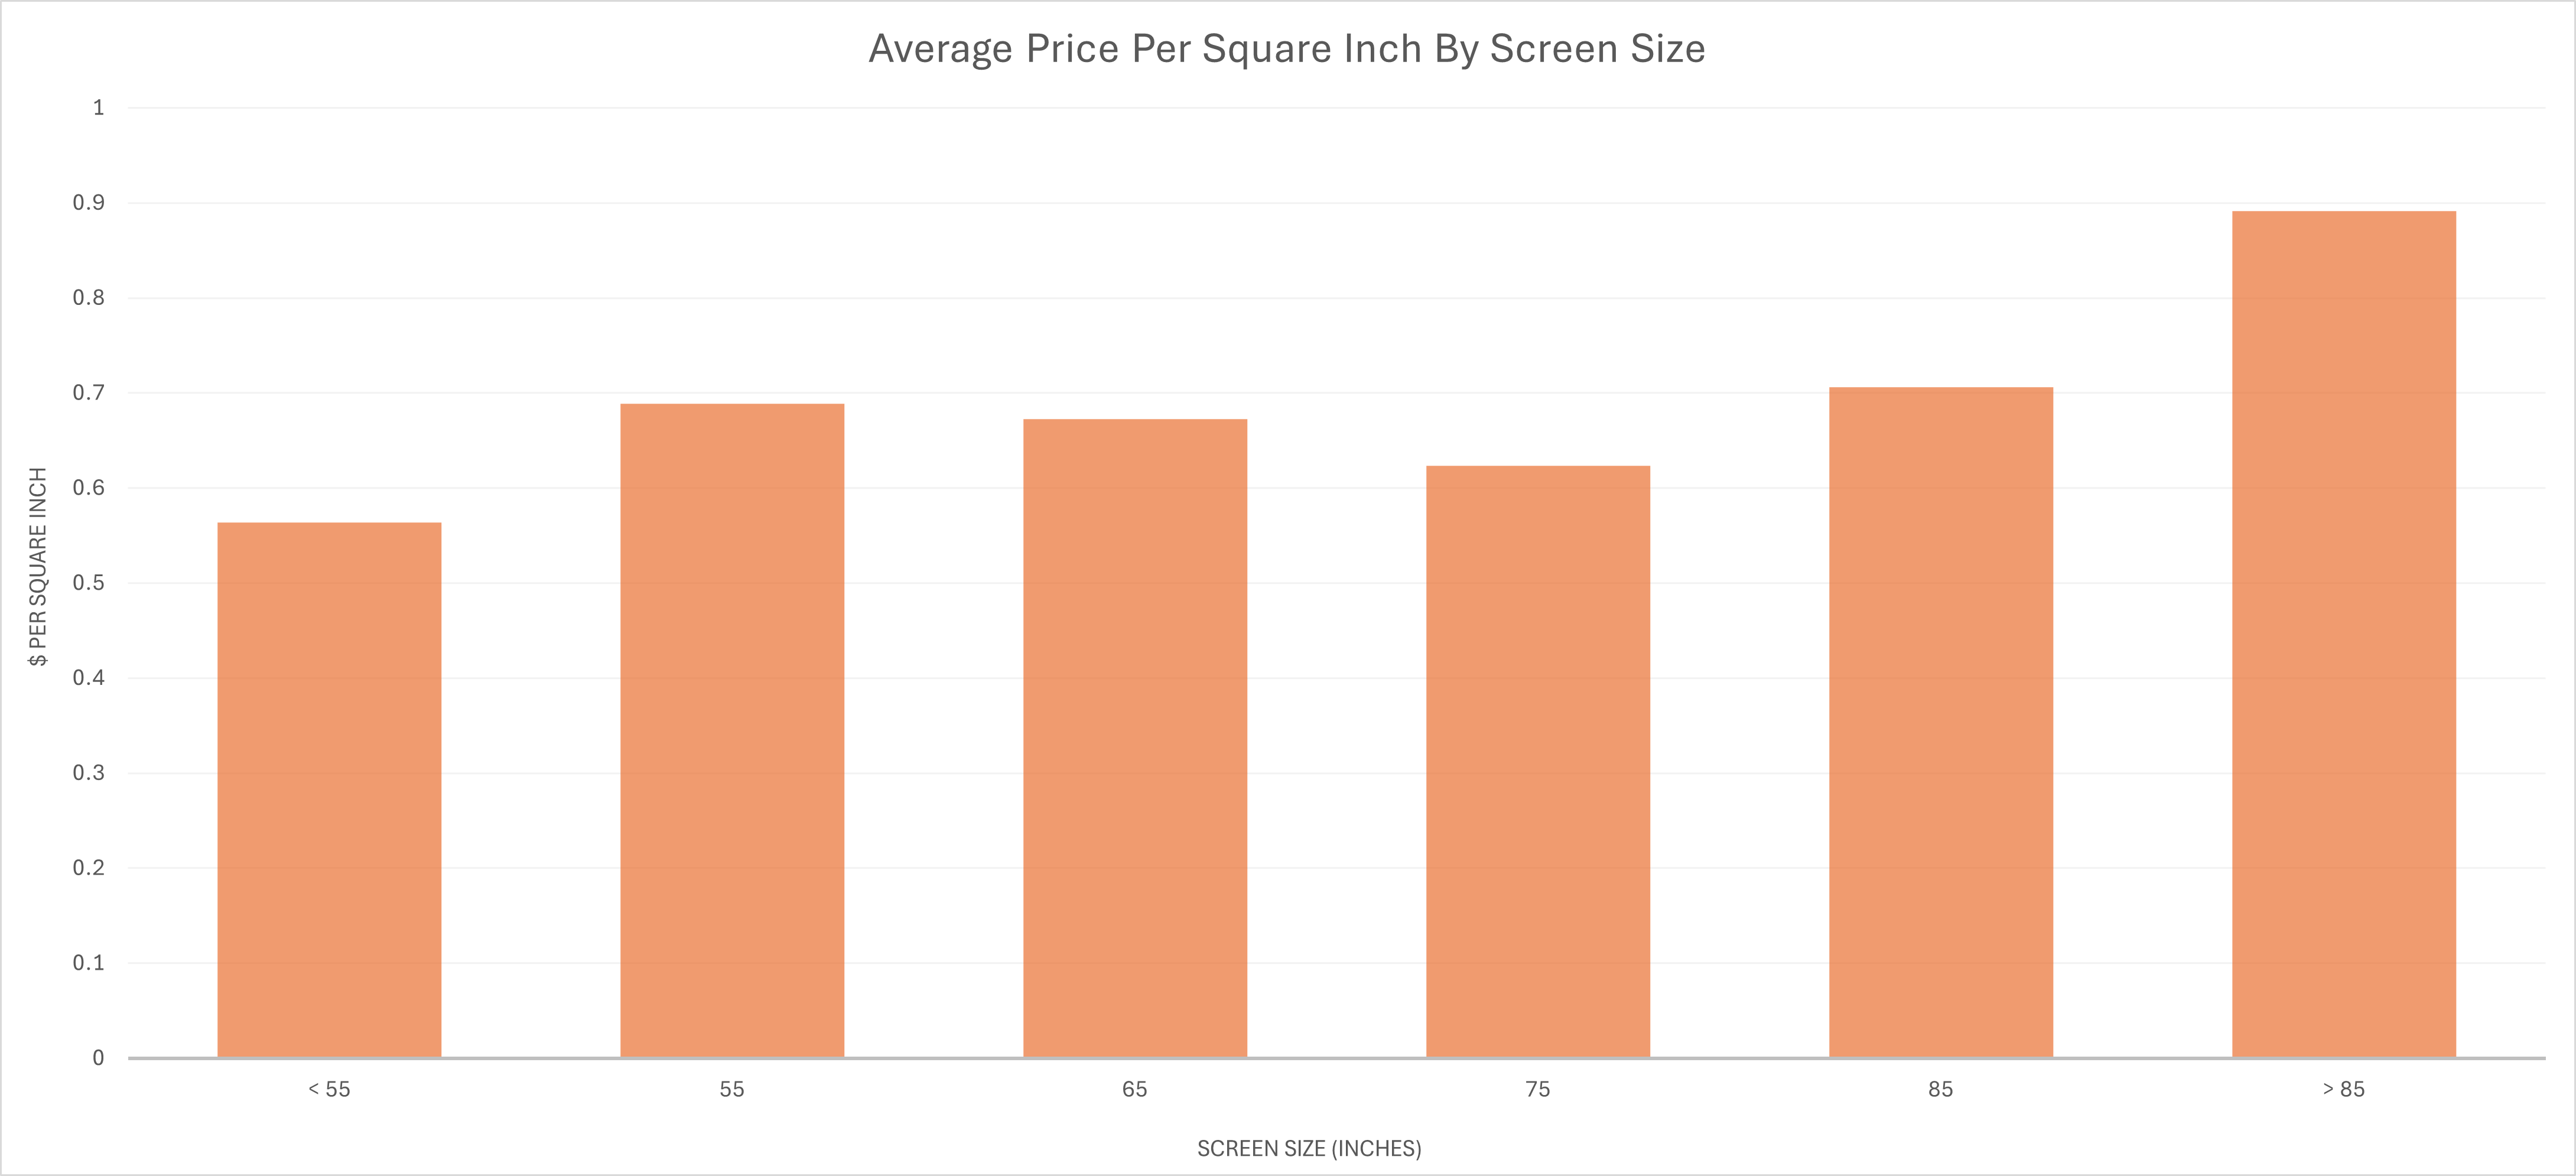
This is mostly useless, except to justify buying a bigger TV. However, I did learn:
- For most popular high end models, the 65 inch models are cheapest / sq inch (e.g Sony A95L, Samsung S90D, LG G4). For most others, it’s the 75 inch models.
- TCL S551F 55" scores the lowest ($0.17/sq inch)
- The lowest scoring OLED is the Samsung S85D ($0.55/sq inch)
- For 100 inches, Hisense QD7 is the cheapest ($0.37/sq inch). For 85 inches, it’s the TCL S551F ($0.22/sq inch)
Prices taken from Amazon, rest of the data from https://comparetvprices.com. Models are from 2022-now.
You must log in or register to comment.
If screens were only about size, I’d be easy.
I’d be easy
an unexpected correlation
Well, I stand by it.
Righteous!
I want a 3 axis chart of price, size, and number of ads in the UI.
Now filter by display technology.
Display technologies are a bit confusing, but this should give you a general idea: https://imgur.com/a/PhTFNZ2
And the type of HDR they support. I got lucky finding a philips a couple years ago that just supports all types so I don’t have to worry about it.
Mine supports none, so I also don’t have to worry about it.
There’s not much point in optimizing completely for price per inch, but when I bought my TV in 2013 I plotted this, and discovered a pretty sharp hockey stick in the graph at 70" and above. So I got a 65" TV. If my graph had looked pretty straight like yours I’d probably just get the biggest that is practical for the space.
I followed a roughly similar process but the flow was more like, “Here’s a 65-inch TV on sale, let’s bump up our 48.”
Same thing for 100 inch models now. Maybe it’ll flatten out in a few years.
Here, it’s not demand vs. suply. It’s demand only, that drives the prices.
Wait, isn’t that a sign for collusion?
Apparently 75" is the sweet spot right now.


